
An extension of our investigation of Behind Bars: A Side-Channel Attack on NVIDIA MIG (USENIX Security '26) which enables model identification. Here we unveil our lab's research into the range of what can be inferred about your neighbor, what the victim is using a model for, and a version of this side-channel attack in the context of the next card over rather than the same one.
When you rent a slice of a GPU, it comes with neighbors.
Your first concern might be cache. Not something you want to share if privacy is a concern. That said, your AI Platform Engineers will be quick to mention that NVIDIA's Multi-Instance GPU (MIG) is enabled and has removed the shared pool: with L2 cache banks, memory controllers and DRAM buses assigned uniquely to each (allegedly now isolated) instance.
Previously we investigated how that isolation does not extend to memory barrier requests, which take effect in every L2 partition on the card regardless of which instance issued them. That commonality enables an attacker to perform continuous reads, and time latency caused by a busy neighbor. From there, with just half a second of timing, we were able to correctly identify five open-weight models running next door with 97% accuracy.
Here, we sought to deepen our understanding of further signal within that noise. Inference is unusually rhythmic work: one beat per output token, and a faster beat for each transformer layer inside that token. Recover the rhythm and you can read what the model is and what it is being used for.
In this article, we uncover how a half second of trace enabled us to determine how deep a victim's model was, correct in 20 of 22 blind readings across sixteen served models, and to pin its decode speed to ±0.25%. The same trace was able to tell us what that model was being used for in real-time. We then extended these reads from the same card, to a different card on the same node. Finally we explore the effect of concurrent requests - an unintended mitigation.
Critically, we note none of this looks like an attack. A nosy neighbor analyzing your AI infrastructure via probe opens no socket, reads no credential, touches no victim memory, and makes only the CUDA calls any tenant is entitled to make. Without a misconfiguration, there's also no signs to warn of this exposure. DCGM will show your tenant as busy, not as being spied on.
One Sliced GPU
Our lab environment: 8xH100 80GB SXM, single node, victim served under vLLM. On it an attacker can end up colocated on a MIG slice of the same card, or further afield.
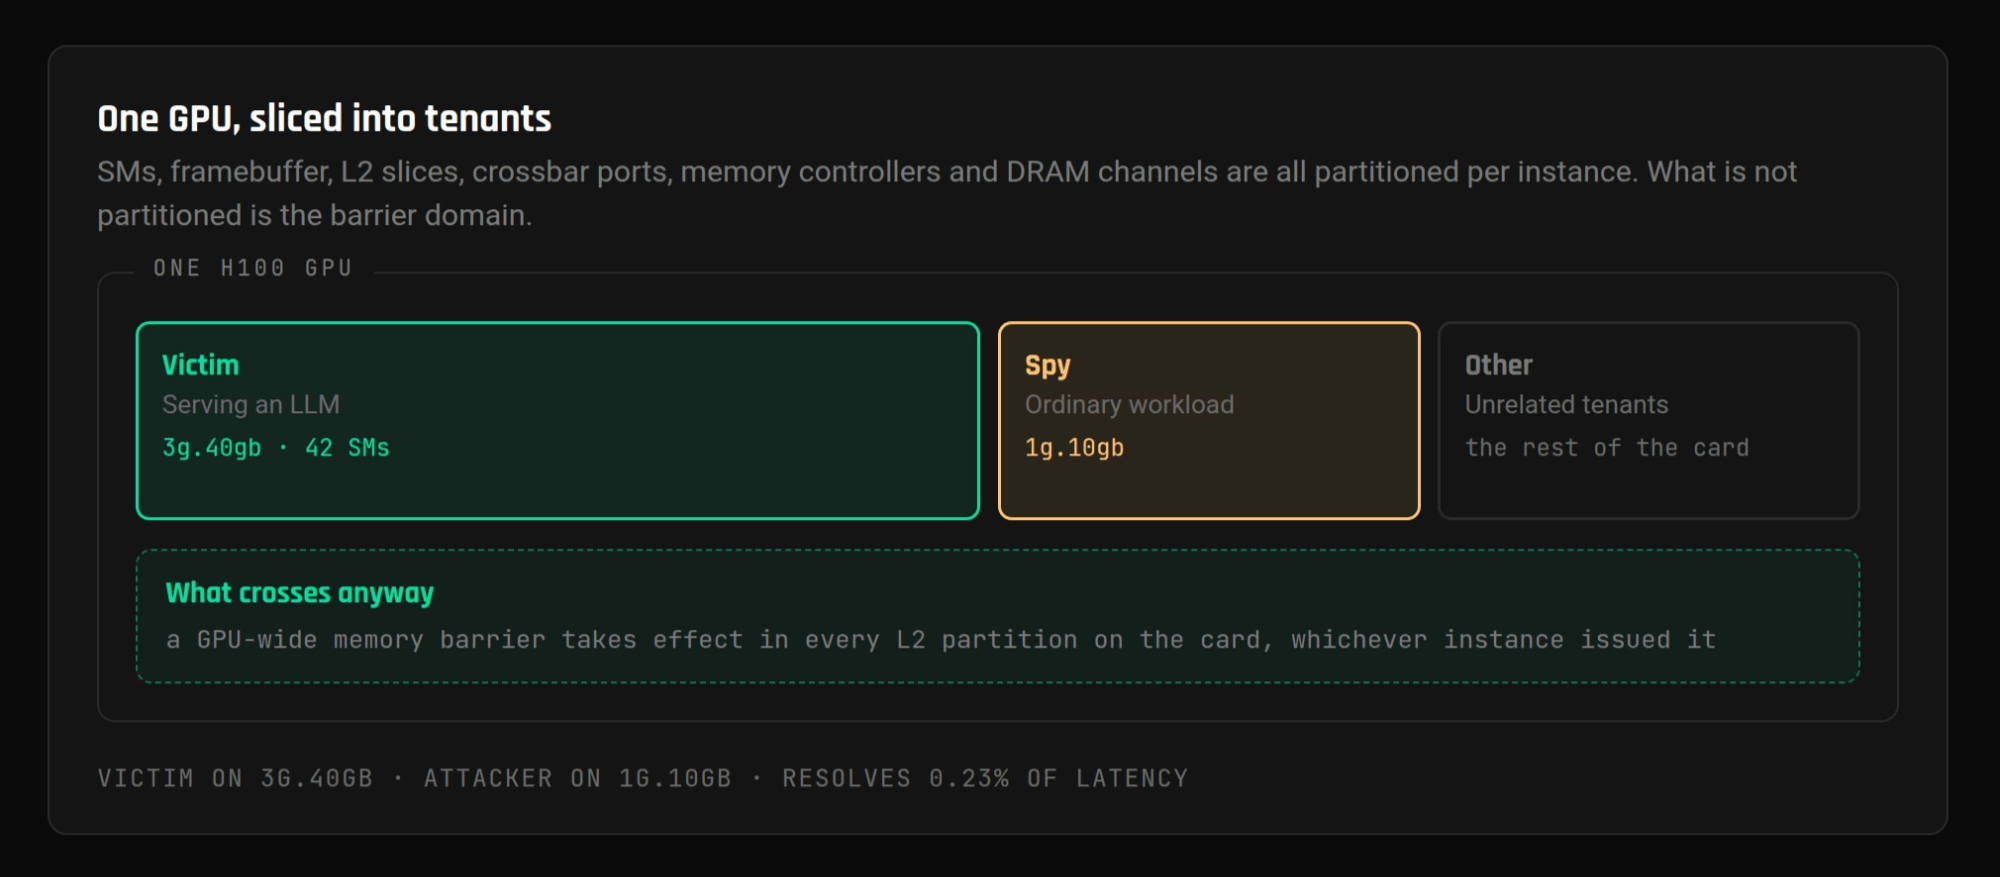
One GPU, sliced into tenants. The partitioning is thorough; the barrier domain is the exception.
The spy slice is not something an attacker writes code to reach. It is handed out by a scheduler, which makes the layout of the node the precondition for everything in the following section.
Counting Model Layers
This technique is borrowed from Behind Bars, presented recently at USENIX Security '26, whose authors have been in direct contact with us.
A model generating text has two rhythms, one nested inside the other. The slow one is the token: every output token is one full pass through the network. The fast one is the layer: within each of those passes the model works through its transformer layers in order, and each layer is its own burst of GPU work.
Both show up in the attacker's timing trace as periodic signals. Pull out the two frequencies, divide the fast one by the slow one, and the answer is how many layers ran per token. That is the model's depth. We ported this methodology to Hopper and reproduced.
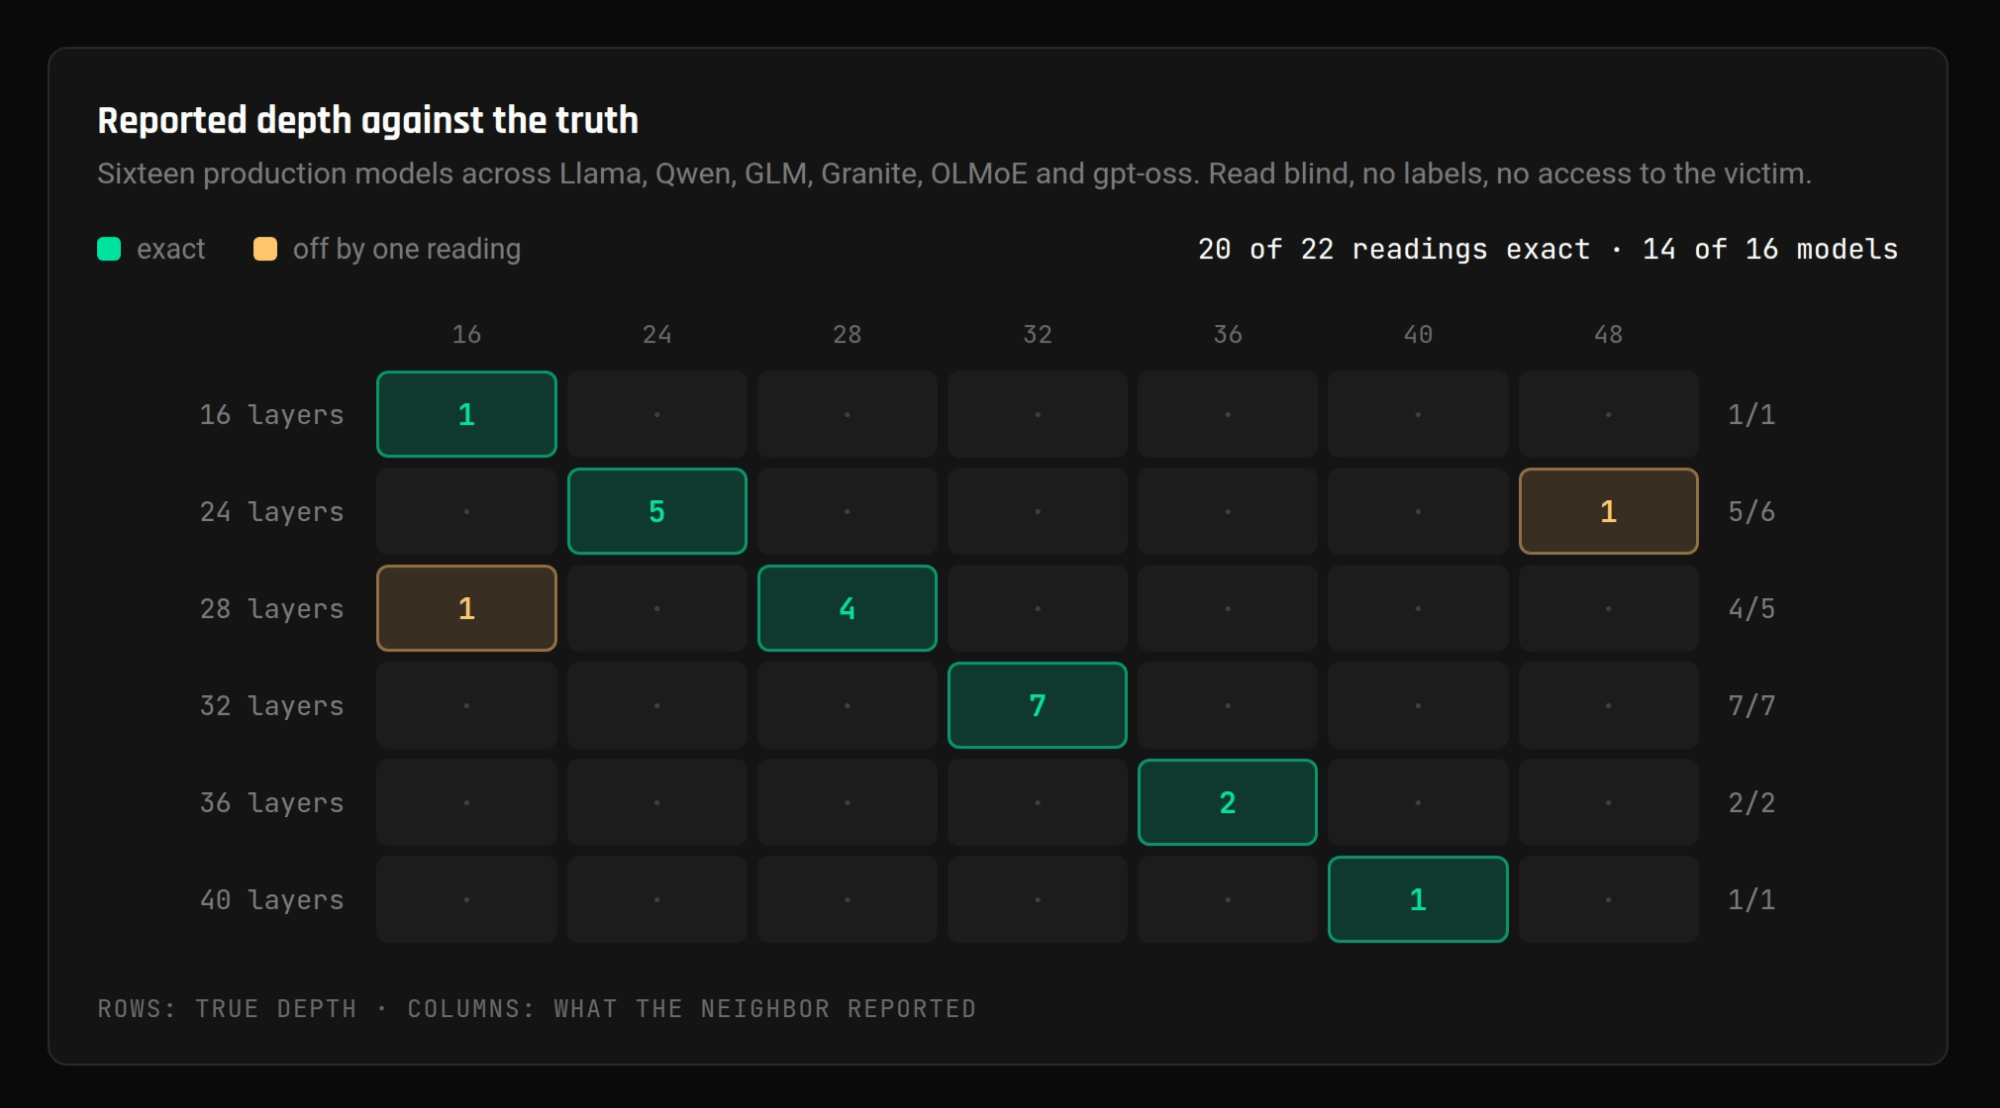
Reported depth against the truth, read blind across sixteen production models.
20 of 22 readings were accurate, across 14 of the 16 models. There are more readings than models because several models were read more than once. The method also has its own measurement of supposed fidelity, and unsurprisingly, the two misses were those provided with least recorded confidence.
Depth is the interesting finding, but there's more to discover from the half second of trace. Each additional readout closes an obvious escape route.
| What comes off the trace | Reading | Why it matters |
|---|---|---|
| Decode speed | ±0.25% | Against the server's own reported figure |
| Identity after a fine-tune | 34 = 34 | R1-Distill-8B returns Llama-3-8B's number. Renaming does not hide it |
| Two models, same speed | 39 vs 34 | Qwen3 and Llama-3 decode 0.2 ms apart and still separate |
| Two models, same depth | 33 vs 34 | Llama-2 and Llama-3 are both 32 layers. Vocabulary splits them |
| Repeatability | 6 of 6 | Same answer a day later, stack torn down in between |
Taken together, those readings reveal sensitive information about your operations: which model a service runs, and whether it is still the same one it was last week.
Determining Model Activity
In order to determine model activity, speculative decoding has to be switched on.
Speculative decoding is a latency optimization. Rather than producing one token per pass, the server guesses several tokens ahead using something cheap, then checks the entire guess in one pass of the real model. If the guess was right, a single step produced several tokens. If it was wrong, the step produced one and the rest is thrown away.
How often the guess survives depends on how predictable the text is. Repetitive JSON is very predictable, so most guesses land and steps are productive. Flowing prose is less predictable, so more guesses die and the server needs more steps to produce the same amount of output.
This changing efficacy of optimization also changes timing. Tokens per step rise and fall with the content being generated, the duration of each step moves with them. Yet another signal to time.
We decomposed the effect to check it came from where we thought it did. 89% of it is how often the guesses land. The 11% is the KV cache growing as the response gets longer.
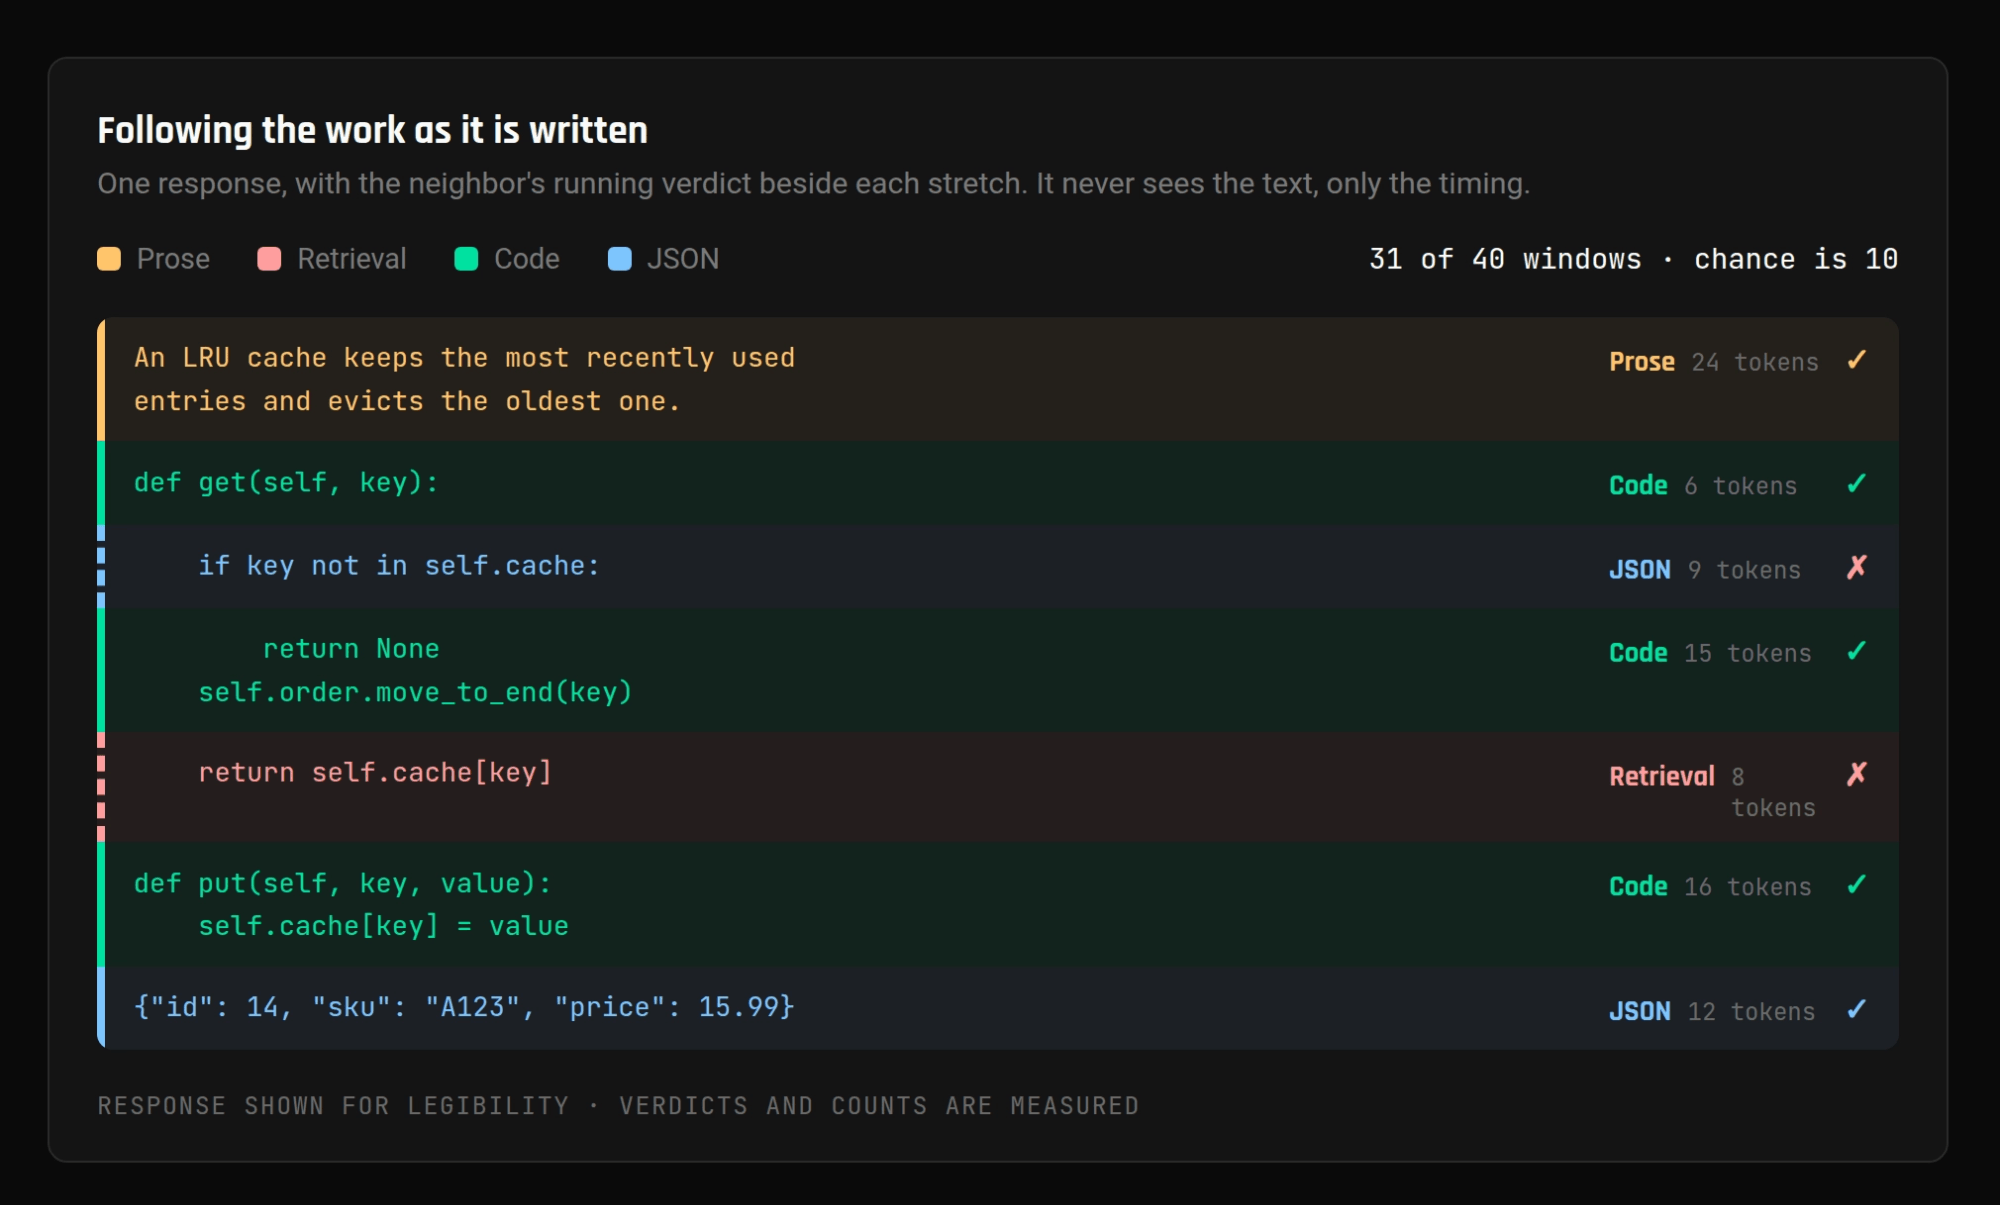
One response, with the neighbor's running verdict beside each stretch of output.
We ran four kinds of workload and scored a classifier on runs it had never seen. It called 31 of 40 half-second windows correctly across prose, retrieval, code and JSON, and labeled all four of the full responses right.
This is a running read on what your neighbor's model is producing, updated twice a second, with no one the wiser.
The Next Card: Eight GPUs, One Fabric
So far, we have demonstrated what's possible with card co-tenancy on a MIG slice. An obvious remediation (if affordable) might be to give each tenant a whole GPU and the side-channel attack risk goes away.
On a single-GPU box, it would. However, on an 8xH100 node, it does not, or at least not automatically. Those eight GPUs are not eight separate machines. They are eight endpoints on an NVLink fabric, and a process sitting on one of them can allocate memory on another and time how long its own reads of that memory take. That permission is due to how your container runtime scopes device visibility.
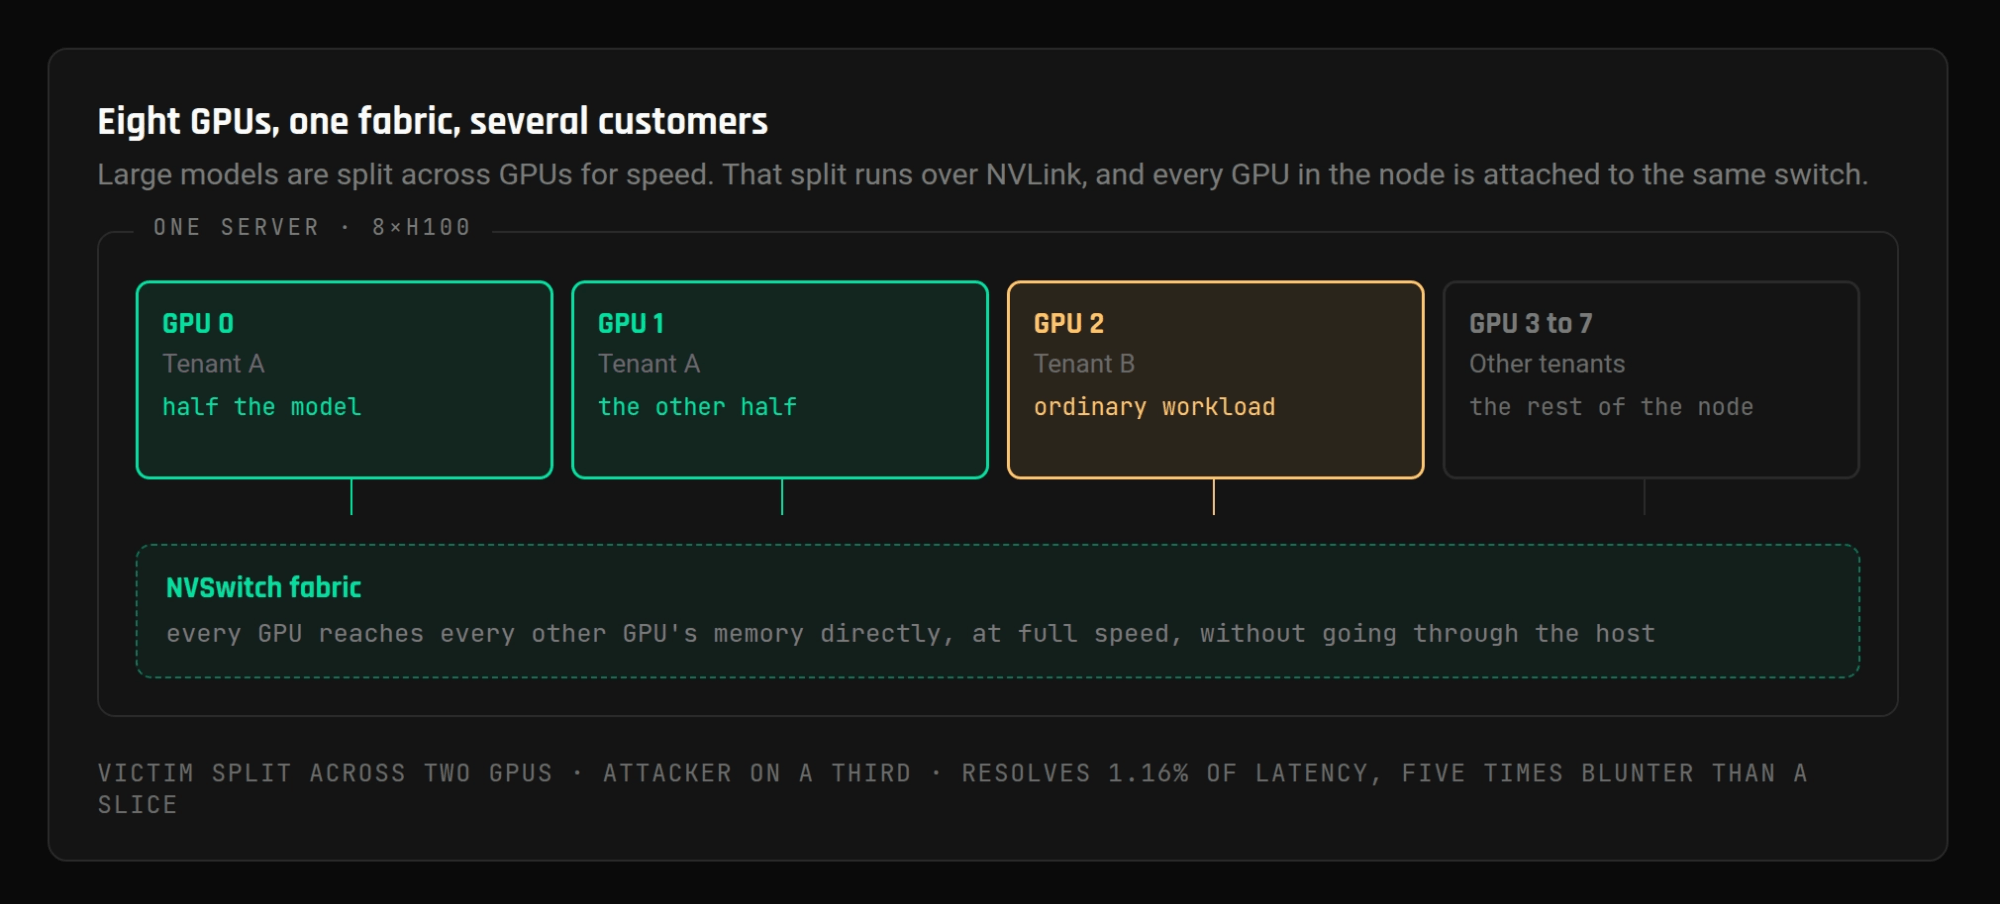
Eight GPUs, one fabric, several customers.
Where that position is available, the technique survives. It is markedly less effective. Here we will share both what is and isn't possible.
Model Identification From Further Afield
Probe design: The probe requires the ability to call cudaSetDevice and cudaMalloc against the shared card. The probe allocates its buffer on the victim's GPU and writes a chain of addresses into it, each pointing at the next. A single thread then walks that chain. Because it cannot know where the next hop is until the current one comes back, the reads cannot be overlapped or prefetched away: each one is a full round trip across NVLink, and each one can be timed on its own. When the victim's GPUs get busy, those round trips stretch. That stretch can be timed.
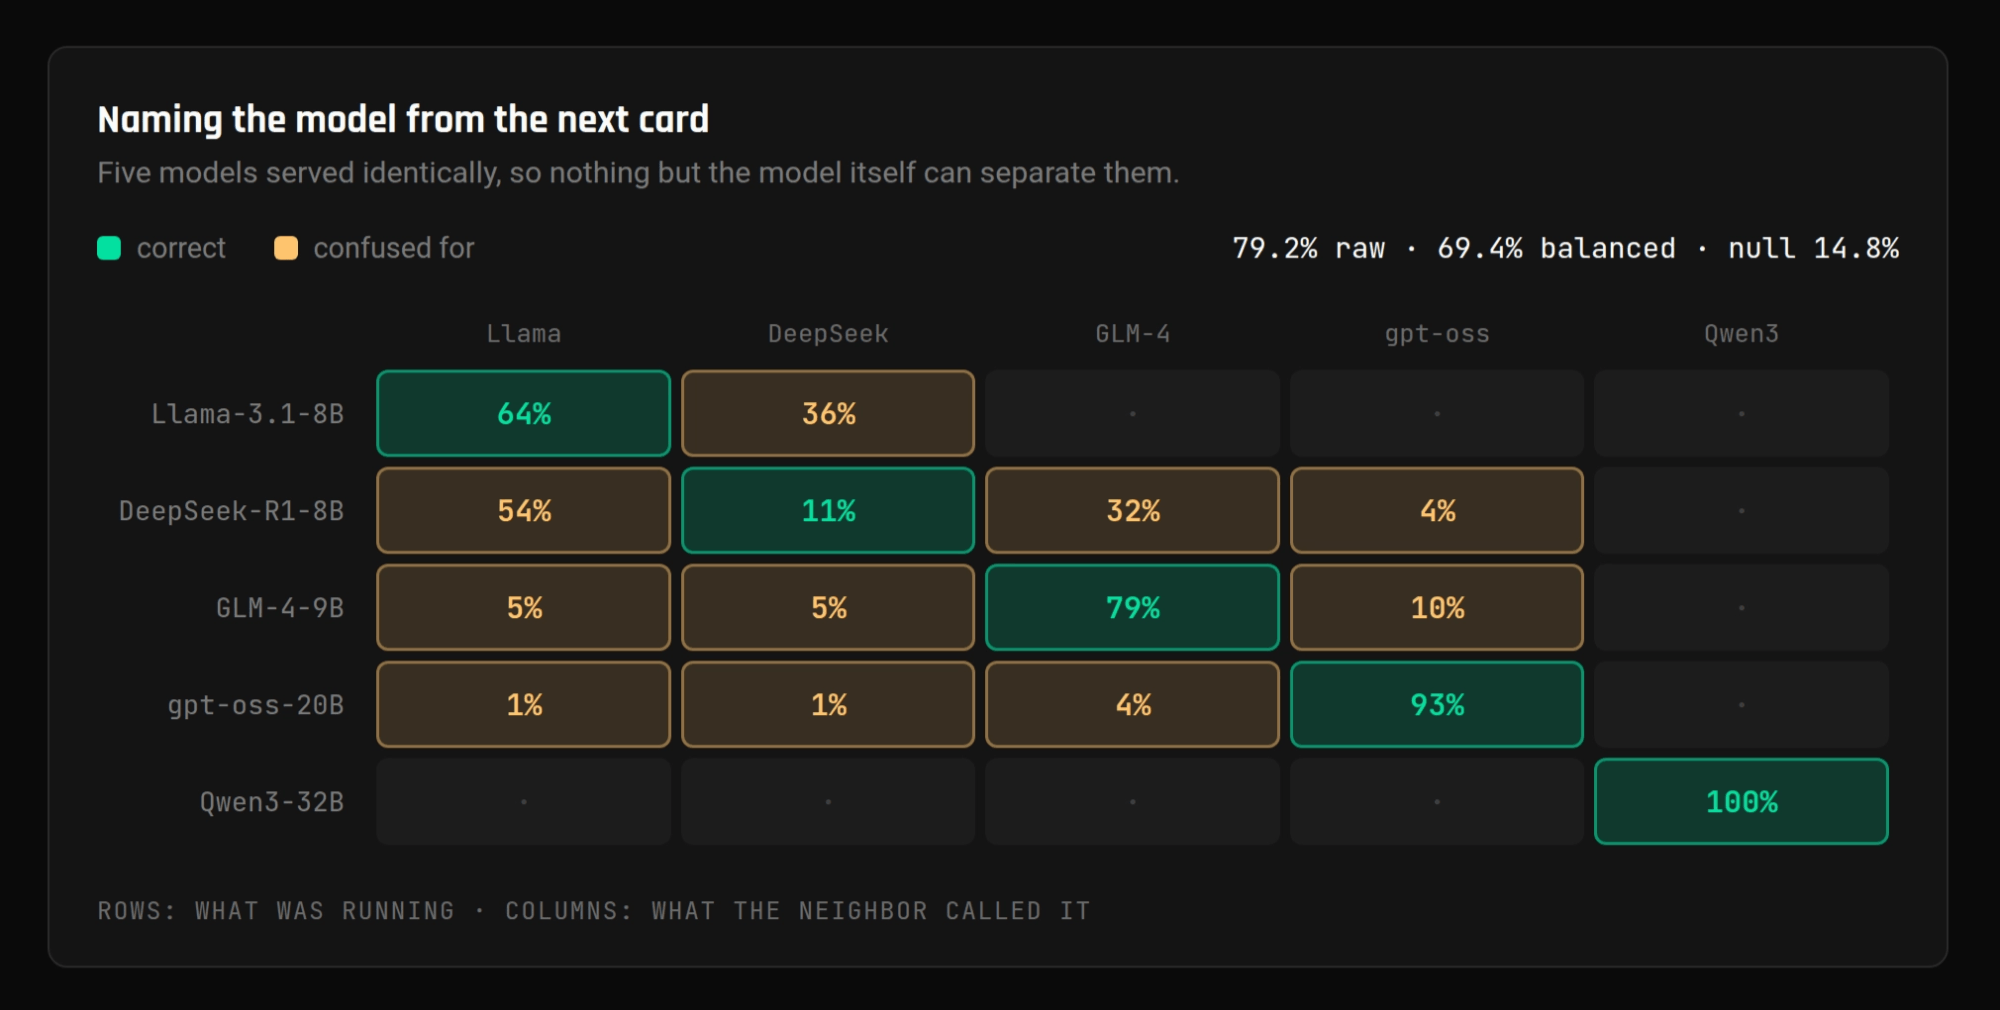
Five models served identically, named from a different card across the fabric.
As you see above, the efficacy when reading from a different card is lower, while still significant. Against a victim on a single GPU the token rhythm comes through at 0.60x the noise floor. Splitting the victim across two GPUs under tensor parallelism lifts it to 2.02x, present but marginal. While our results had significant accuracy identifying models, details on layers/depth never came through from this position in any configuration we tested.
A Result We Retracted
An early run appeared to separate Llama-3-8B from Llama-3.1-8B at 78.6% balanced accuracy. We have withdrawn this finding.
Those two models ship byte-identical config files, so our timing channel should not be able to identify an architectural difference. What our analysis had latched onto was session identity: incidental differences between two separate serving runs rather than between two models. Once we gave it more data, the accuracy decayed to 46.7%, which we put to chance.
Pairs of models with identical configs are now permanent negative controls in our harness.
Unexpected Results
Across eleven model configurations, prose produced the fastest step cadence in ten of them.
What varied was how loud it is, and that swings by a factor of nineteen across the same eleven configurations. While we expected it might, model size did not seemingly move it.
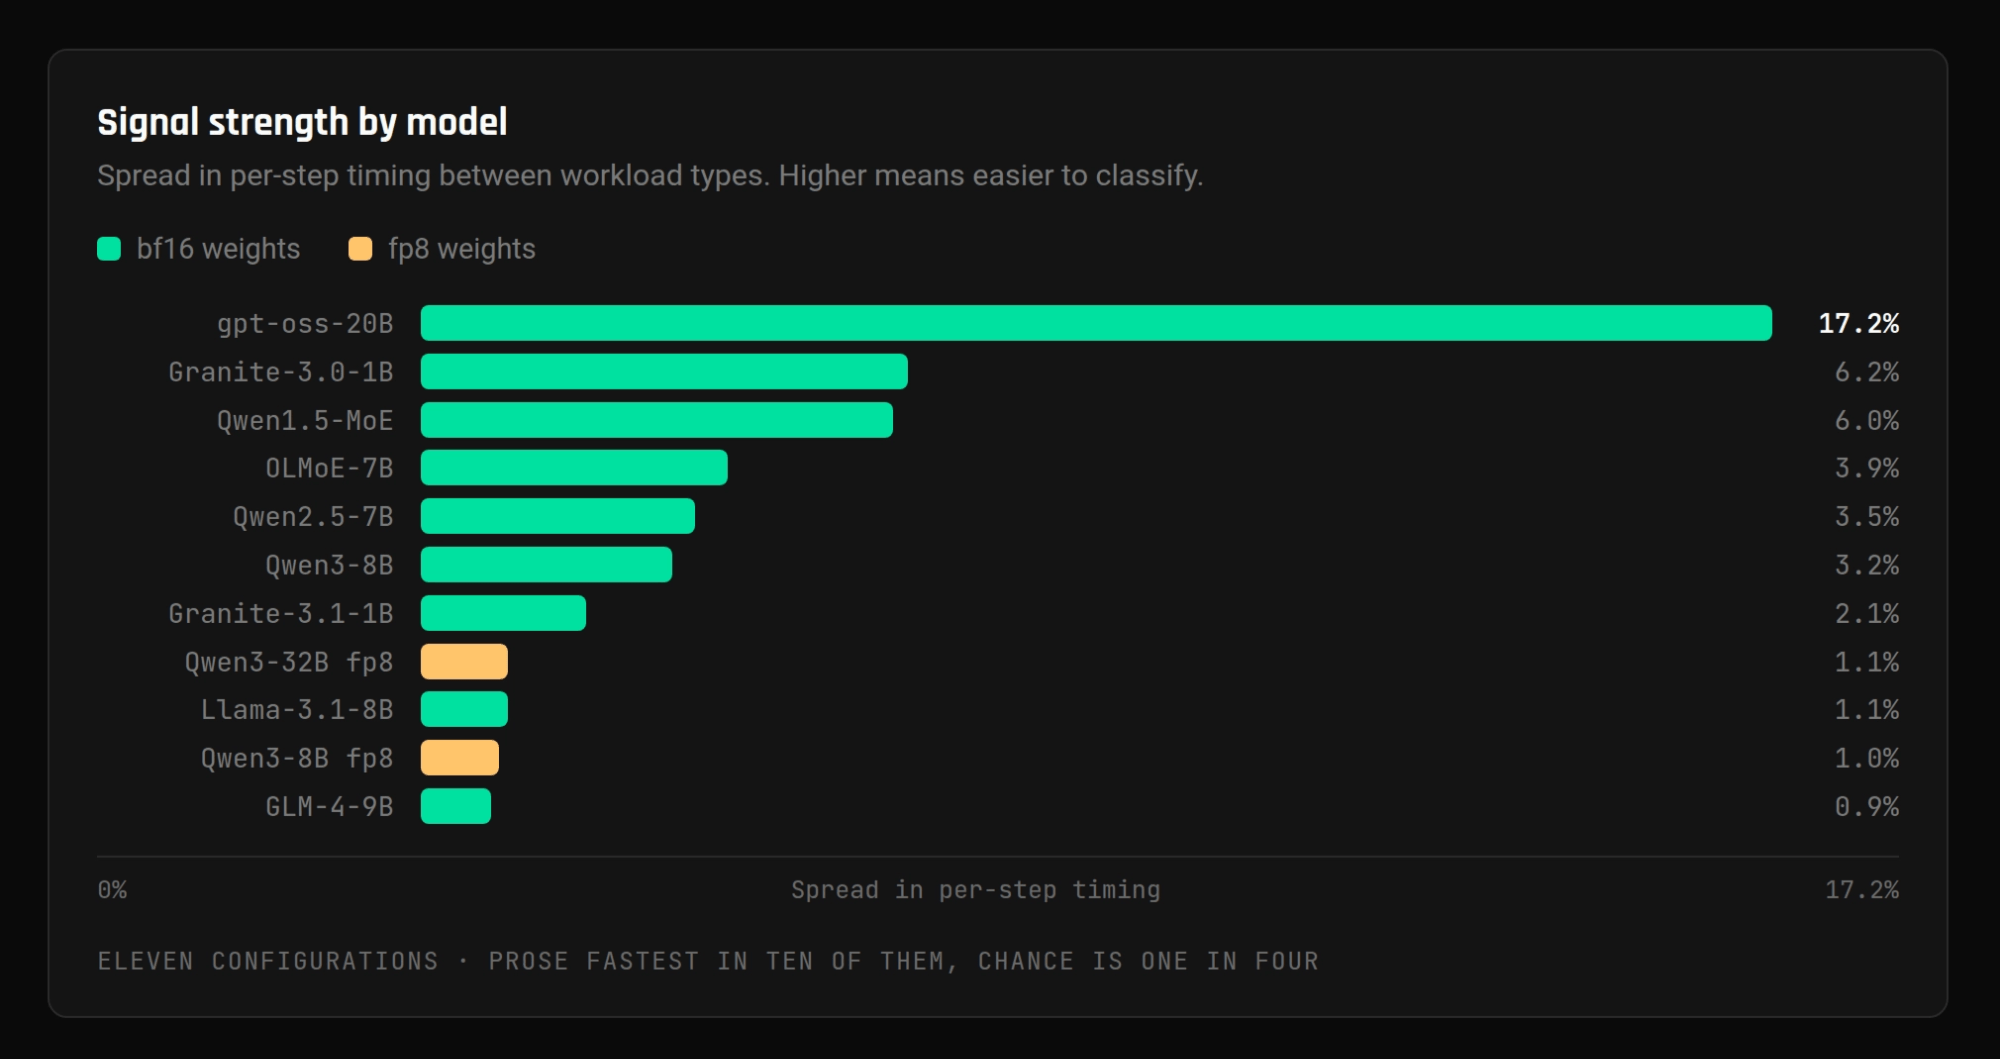
Spread in per-step timing between workload types, across eleven configurations.
Quantization moves it further than size does. Qwen3-8B in BF16 measures 3.22% across four repeats. The same model quantized to FP8 drops to 0.98%, and the two ranges do not overlap. Qwen3-32B, four times larger but also FP8, gives 1.09%, indistinguishable from the 8B.
The reason is the acceptance rate again. FP8 makes the output more repetitive, so speculation succeeds almost everywhere, and the contrast between one content type and another flattens out.
Unintended Mitigations
Our measurements so far have been single requests in flight. Lab appropriate, but atypical.
Production servers typically batch many in-flight requests into every decode step. Once they do, no single request's content determines how long a step takes, because every step is a blend of whatever else is in the batch.
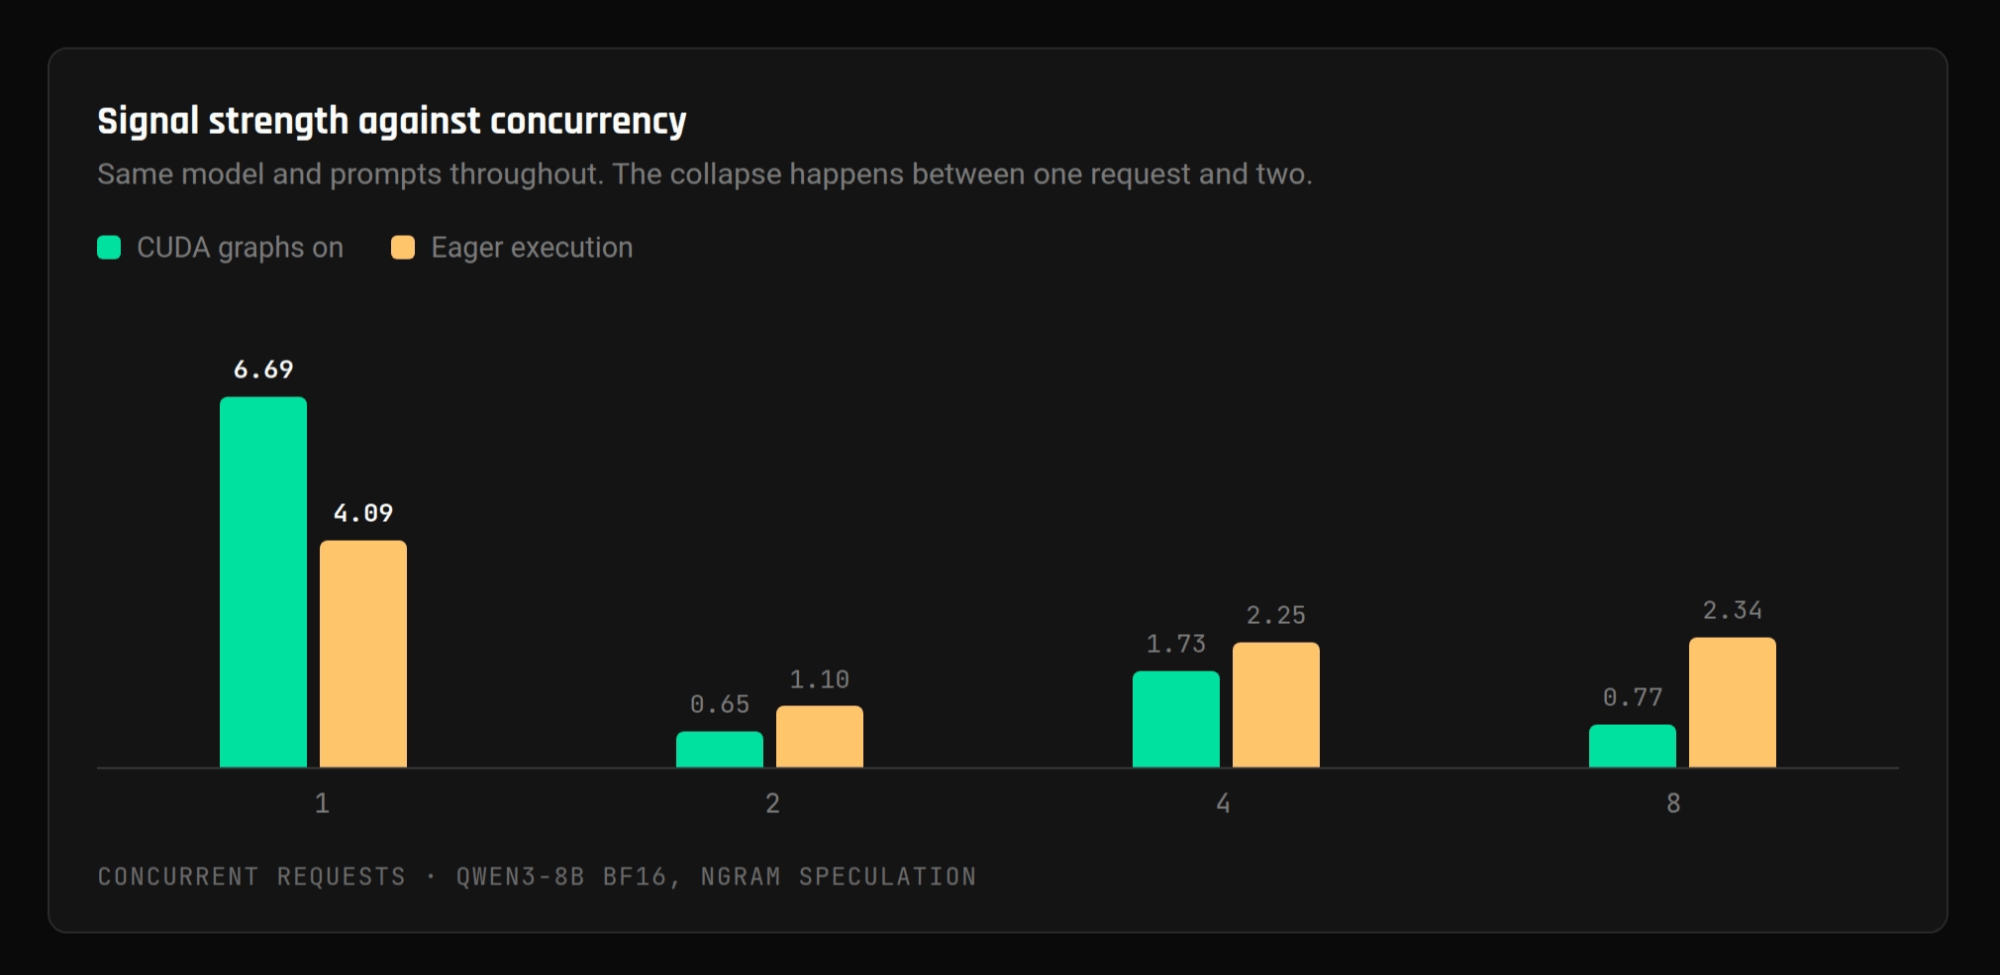
The collapse happens between one request and two, in both execution modes.
As soon as requests move from one to two (then four and eight) running concurrently, observe the change above. It reproduces with CUDA graphs on and off, and graphs at batch one gave the strongest signal we measured, so the cause is concurrency rather than compilation.
This means, for this side-channel attack at least, the continuous batching every production inference server runs, for throughput reasons that have nothing to do with security, is an effective mitigation.
While staying busy is a defense, it is a security control nobody chose, nobody documented, and nobody is monitoring.
A latency-tuned deployment, a low-traffic endpoint at three in the morning, or a dedicated single-tenant instance each drop the concurrency mitigation and thus enable the channel again, without a security change log being filed.
Two other settings already mentioned further impact exposure, and they too aren't security controls. Device visibility: the cross-card probe has to allocate on your GPU, and per-container device assignment contains it. Speculative decoding: the workload readout exists only where someone switched it on, though the depth readout does not depend on it.
Catching Fingerprinting
Our readings were taken by a container performing relatively unsuspiciously. No exploit, no privilege escalation, no access to victim memory, no file, no socket, no IPC. DCGM shows the tenant as busy, not as being fingerprinted, and a packet monitor reports nothing left over the network.
Your current stack won't see this. With no instrumentation below the CPU, a tenant serving a model and a tenant counting its neighbor's layers are the same process doing CUDA.
The probes we used here issue loads whose latency you can resolve, and time them against a high-resolution clock. That is not a by-product of the payload, it is the payload.
The probes produce two shapes:
- From the same card, the probe reads at scale: enough concurrent threads that a sub-percent contention effect resolves at all.
- From across the fabric, it reads in series: a single thread chasing a pointer so that every hop is forced into its own round trip and can be timed.
An attacker can rename the symbol, change the constants, restructure the loop, split it across kernels. A probe will keep the fundamental design of reading, timing, and discarding. This provides a shape for us to hunt for, as a kernel spinning dependent loads against a clock while doing no useful arithmetic is atypical.
Stealthium's Detection
Stealthium instruments the NVIDIA driver and CUDA runtime from the kernel, below anything an attacker workload can evade. For this class it works in four stages:
- Capture at load time: when a process loads a CUDA module, the agent keeps a copy of each kernel's compiled bytes and indexes them by content hash. This happens for every kernel, to enable analysis of what actually executes.
- Retrieval by hash: when launch behavior crosses a threshold, the detection server asks the agent for one specific kernel and receives exactly the bytes it captured. Nothing is recompiled or reconstructed from a symbol table.
- Disassembly: that kernel is taken down to the native GPU instructions the hardware ran, a level below the CUDA the developer wrote and below the portable form the compiler emitted on the way.
- Static analysis: the question asked of the instruction sequence is structural rather than statistical. Does this kernel sit in a loop that issues loads, times them, and discards what it read?
Launch telemetry is our trigger. Specifically, a process relaunching one small kernel thousands of times inside a slice, holding a working set of a few kilobytes and moving almost nothing to or from the host. Reading the instructions moves us to verdict.
Beyond behavioral detection, operators require context. Or, put another way, they need a seating chart. Which instances exist on which card, and which processes hold contexts on which devices? Both attacks in this post are gated on a placement decision that a scheduler made long before any probe code ran. Stealthium collects that layout as first-class telemetry, so the set of tenants who can reach each other arrives attached to the alert rather than being reconstructed afterward.
This answers the access requirement flagged earlier. Identifying a container calling cudaSetDevice and cudaMalloc against a card it has no business touching, as it is happening.
Accelerator Security & Observability
From the researchers behind Behind Bars:
The stakes of GPU security have never been higher, and our work is a reminder that we cannot outsource that security to vendor claims. Hardware partitioning and similar mechanisms must be verified, not trusted; the guarantees they offer are only as strong as the scrutiny they have withstood.
Cheng Gu, Reese Levine, Zhenkai Zhang, Tyler Sorensen and Yanan Guo, authors of Behind Bars, in our correspondence.
We could not agree more.
This is one channel, against one kind of workload, on one generation of hardware. Frankly, more alarming than this specific research is the fact that current security stacks are unable to see this or other attack classes targeting accelerators. Traditional tooling misses every one of them for the same reason it misses this one.
For Stealthium, the telemetry that detects this attack is what surfaces others: cross-tenant contention channels, unauthorized inference on a rented slice, model weight and KV cache exposure, mining tucked inside a legitimate-looking allocation.
For anyone selling or renting partitioned capacity, we pose to you these questions of your multi-tenanted environment. How do you know if your neighbor is or isn't spying on you, & what else do you know not about your accelerator environment without forensic runtime protection.
See Stealthium in action. Book a demo.
Methods & Attribution
Environment: measured on 8xH100 80GB SXM, single node, vLLM 0.27.1 with ngram speculative decoding. MIG figures from a 3g.40gb victim and a 1g.10gb attacker on the same card; NVLink figures across an NVSwitch fabric with the victim under tensor parallelism across two GPUs.
Repeatability: repeated measurements are four runs per configuration with greedy decoding, so the text is identical across repeats and only the timing varies. The workload response shown above is illustrative; its verdicts, counts, and every figure in this post are measured.
What does not leak: individual tokens. Per-token templates across every alignment, grouped tokens, and permutation nulls all landed on chance. The sensitivity behind that null is known, roughly 1% of latency over NVLink and 0.23% on MIG, which makes it an informative null rather than an empty one.
Attributing original research: the membar findings and layer counting are as published in Behind Bars (USENIX Security '26) by Cheng Gu (University of Rochester), Reese Levine (UC Santa Cruz), Zhenkai Zhang (Clemson University), Tyler Sorensen (Microsoft and UC Santa Cruz) and Yanan Guo (University of Rochester). Our contribution here is the port to Hopper against MIG partitions and the blind evaluation across sixteen models.
Speculative decoding as a side-channel was first shown by When Speculation Spills Secrets (arXiv 2411.01076), which fingerprints queries from network traffic at considerably higher accuracy than anything here; our contribution on that front is the hardware vantage point, against which packet padding and iteration-wise aggregation do nothing, plus the concurrency bound.
The NVLink surface was opened by NVBleed on P100 and V100 (arXiv preprint 2503.17847). SideLink (Baddour, Banerjee and Sanadhya, Journal of Hardware and Systems Security, April 2026) has since carried NVLink contention channels onto Hopper, over direct peer-to-peer links, fingerprinting hashing and crypto-mining workloads at up to 96.2% accuracy. What is new in our reproduction is the fabric and the victim: NVLink 4 through an NVSwitch rather than a direct peer link, and an LLM inference server whose model properties are the target rather than a workload category.